7 Signs Your Website Is No Longer a Good Fit for Its Current Hosting
Slow website, frequent errors, heavy dashboard, and unhelpful hosting support? The problem may not be WordPress itself, but a hosting foundation that no longer fits.

There is one situation that confuses people a lot.
PageSpeed Insights is green.
The number looks good.
Sometimes it is even above 90.
But when you open the website, it still does not feel pleasant.
Sometimes the initial load feels slow. Sometimes it only feels heavy after you start scrolling. Sometimes the homepage seems fine, but the service pages, articles, or checkout are slow.
If that has happened to you, the problem is usually not that your feeling is wrong.
The real issue is that many people assume a green score means the website is fast in every situation. It is not that simple.
A green PageSpeed score is a good sign, but it does not automatically mean the real user experience is good too.
If your website feels slow even though the test looks good, the bottleneck is usually somewhere that is not obvious from a single number. If you want help mapping it, you can start with a website maintenance audit or a free consultation.
This is where the biggest misunderstanding usually happens.
The green color in PageSpeed makes people feel everything is fine. Visually, it does look reassuring, especially once the score is in the 90s.
But PageSpeed is not a tool that decides everything from one color.
It tests one page, in one condition, with one method. Real websites are used by people who:
So when a website feels slow even though the score is green, that is not strange. It happens a lot.
Many website owners only check the homepage.
That is understandable, because the homepage is usually the first page people see. The problem is that the homepage is not always the heaviest page.
What is often slower is:
So if the homepage gets a 94, that does not automatically mean the whole site is healthy.
I often see websites where the homepage looks light, but internal pages are much heavier because of content structure, a builder, a specific plugin, or extra scripts that only load on certain pages.
That is why, if you want to assess performance honestly, do not stop at the homepage.
This point is very important.
PageSpeed Insights shows two kinds of data that often get mixed together:
Lab data is useful for diagnosis.
Field data is closer to the real user experience.
If the lab result is green but the site still feels slow in the real world, I usually want to check:
If you have not read this yet, I recommend continuing with my article about Core Web Vitals Passed vs a 100 PageSpeed score, because I explain the difference in more detail there.
Sometimes the design is not heavy. The plugin count is not high. But the site still feels slow the first time it opens.
When that happens, I usually suspect the server foundation.
One signal to watch is TTFB.
If the server responds too slowly, users will still feel a delay at the beginning even if the page becomes light after that. Technically, that can come from many things:
At that point, small front-end optimizations often do not help much. The biggest improvement usually comes from a stronger hosting foundation.
That is why I often say: do not rush to redesign everything if the bottleneck is actually the server. For this kind of problem, our website maintenance service can help if the real issue is stability and response time.
There are also cases like this:
once cache is enabled, the homepage feels fast, but certain pages are still slow.
That is normal too.
Not every page can be treated the same by caching.
Pages such as:
often do not benefit from caching as much as normal static pages.
That means a site can look good when tested on one page but still feel slow when users go through a more dynamic flow.
This is why a good score does not always equal a smooth experience across the whole site.
This is something I see often in WordPress.
The numbers might still look acceptable, but when people use the site, it feels heavy, a little delayed, or not fully settled before the layout becomes stable.
That usually happens when the page structure is too complex:
Problems like this do not always show up dramatically in one final score, but they are still felt by real users.
In situations like this, the best solution is often not just minifying assets. It is simplifying the page foundation itself.
Analytics, pixels, live chat, heatmaps, WhatsApp widgets, video embeds, external fonts, review widgets, and marketing scripts are often seen as normal.
And to be fair, many business websites really do need them.
The problem is that every additional script brings its own cost.
Sometimes it does not destroy the score, but it is enough to create:
If users feel those things, they will still call the website slow, even when your test looks fine.
This point is often forgotten.
Performance tests can be run under simulated conditions. Real users arrive with much more variety.
They may open your site from:
So even if the result looks good on your screen, the real user experience may not be as nice.
That is why I trust a combination of field data, technical audits, and real-life usage more than one score alone.
This is one of the sneakiest traps.
Some websites look fast when they first appear. The hero section shows up quickly. The score is green. But once people scroll, click, or interact further, the site feels heavy.
When that happens, the root cause is usually:
So a site that opens fast is not always a site that feels fast while being used.
And for users, the important part is not only the first moment the page appears, but the full experience of using the site.
If a website feels slow even though the PageSpeed score is green, I do not start with the number.
I start with more basic questions:
People often stop too early after seeing a good score.
It does not. Internal pages can behave very differently.
The score is a clue, not the full diagnosis.
Both can have different causes.
A green PageSpeed score is a good signal, but it is not proof that the website is fast in every situation.
A website can still feel slow even when the score is good because the real issue may be in:
So if your website feels slow, trust the symptom first. Then audit the cause properly.
Because the real goal is not to get a green color.
The real goal is to make the website truly feel fast, stable, and pleasant for real users.
If you want help finding the bottleneck, you can start with our website maintenance service or contact me.

Founder of Harun Studio, web developer, blogger, and hosting reviewer. He helps business owners build healthier websites through design, development, and long-term maintenance.
Explore more insights that connect closely with this topic.
Slow website, frequent errors, heavy dashboard, and unhelpful hosting support? The problem may not be WordPress itself, but a hosting foundation that no longer fits.
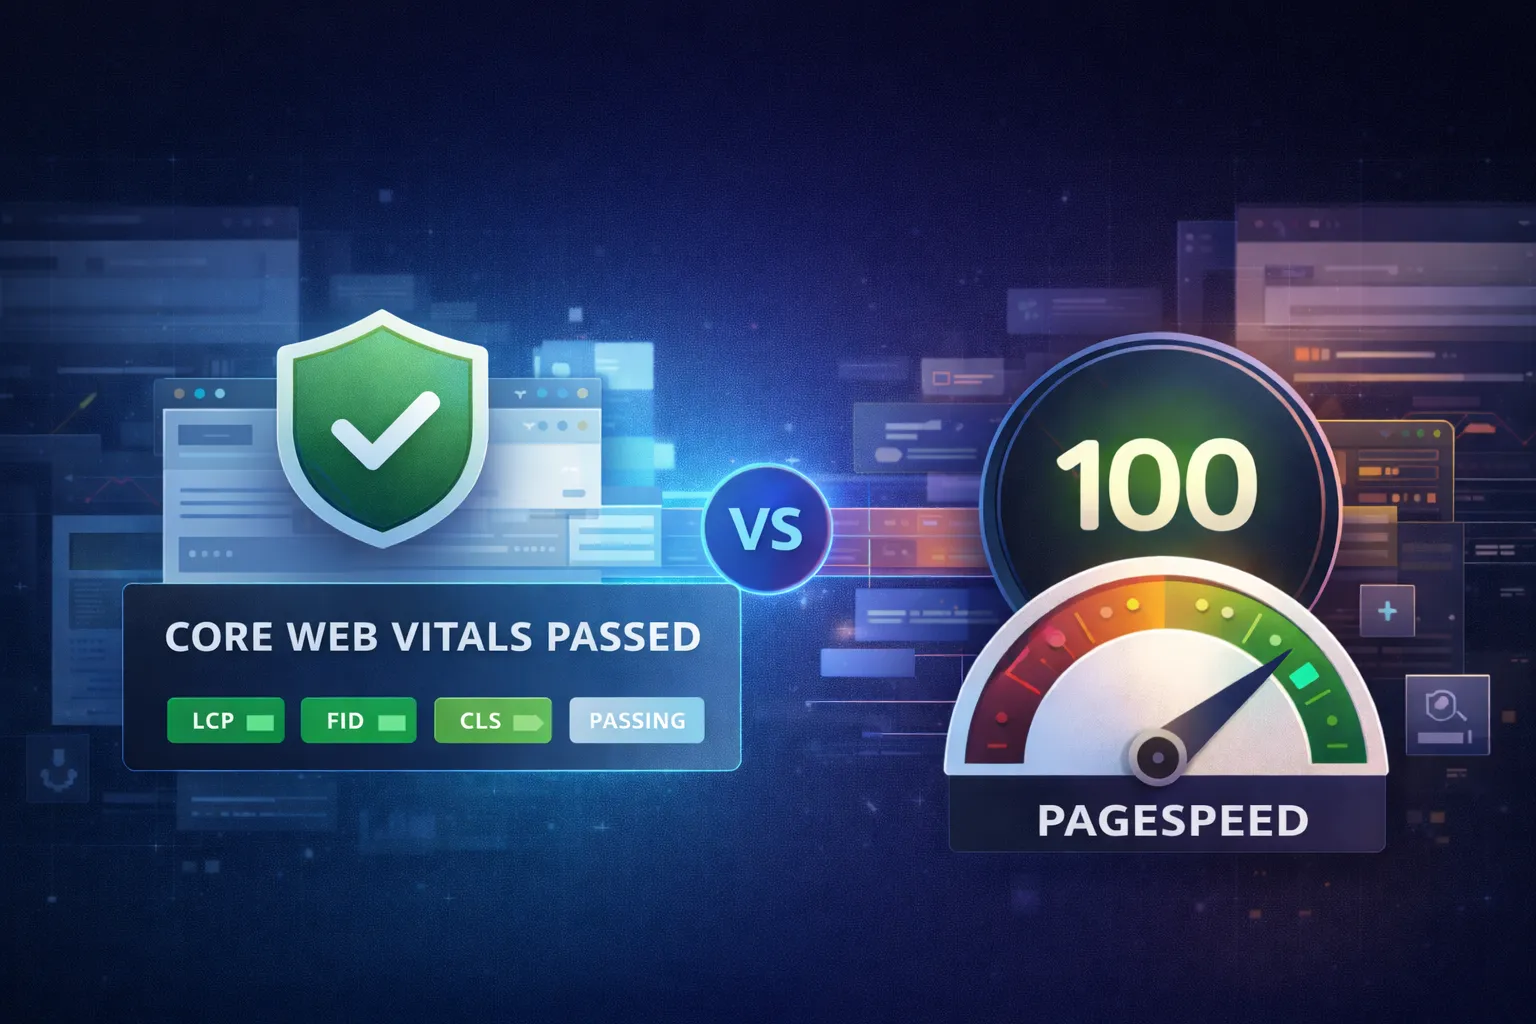
A fast website does not always need a PageSpeed score of 100. Learn the difference between Core Web Vitals and PageSpeed Insights, why people often misunderstand them, and how to read performance metrics more accurately.
Discover 5 fast and effective ways to speed up WordPress, from premium hosting to lazy loading, and improve performance dramatically.